Apply The Bell Curve to Predict Retail Sales in Your Gym
Imagine a packed 30,000-square-foot climbing gym. The lead wall looks like a tangled spiderweb, the bouldering pit is ringed with climbers and onlookers. There are at least 400 people and an appropriate cloud of chalk dust throughout the space.
What if I bet you a shiny quarter that I could guess the top three most common shoe sizes and the quantity of each within that gym? Would you believe me?
If you thought, “yes!” then you probably already know about normal distributions, also known as a Bell Curve, Gaussian, or Gauss distribution. If you are lost, then this article is for you.
The Bell Curve may be the number one tool for retail buyers when it comes to shoes. This is especially true with the industry method of pre-season ordering becoming the preferred method to get big discounts on your wholesale prices.
We’ll give you a quick summary of what all that statistical jargon means and provide a simple tool to both demonstrate the principles, and apply them to help place smarter pre-seasons for your retail department.
Simply defined, the Bell Curve shows that for certain variables, the probability of any given result is predictable to varying degrees, depending on how close they are to the average result.
Lucky for us, the size of a human foot falls into this category!
In 2019, the scientific journal Nature did a survey of foot sizes, with roughly 1.2 million people across three continents. Each of the charts (whether by country or by gender) is roughly “bell” shaped, hence the name. These charts show foot length in millimeters, but this can be nearly perfectly translated into shoe sizes.
With larger sample sizes, the predictability of the results increases.
What this means for you, as an owner or retail professional in the indoor climbing industry: you can use this data to help predict your future sales and make more educated pre-season orders!
VIEW ALSO: The CWA's Retail Webinar Series
Pre-season programs are the key to healthy retail space, especially right now with inventory shortages due to international supply chain issues. The process significantly bolsters margins and helps to ensure allocation, as preseason orders take priority over orders placed as an ASAP order. Pre-season orders for most brands are not hard orders, meaning they can be adjusted before shipping.
Never again must you blindly guess which shoes require four pairs of backstock and which require only one.
Explore The Study: “Analysis of 1.2 million foot scans from North America, Europe, and Asia"
Unfortunately, the results vary a meaningful amount by geographic location. Each brand tends to be a little different, both in terms of the fit of their shoes and the scale they use, US vs. EU. Therefore, the best bet is to use a combination of actual or historical data and your newfound knowledge of the Bell Curve to predict future trends.
My experience as a Retail Director for Summit Climbing Yoga & Fitness' eight locations taught me just how valuable this tool can be. As a new Retail Director with no pre-season ordering experience, I used a simple model and some historical data to predict future sales. Summit Climbing has provided sample 2021 sales data for their Scarpa shoe sales to help demonstrate this point.
As seen in the chart, the average shoe size for their sales is 41.5 and nearly 15 percent of their shoes sold were this size! Summit Climbing has a meaningful investment into retail as a company stance and eight locations, their data looks beautifully bell-shaped. With larger sample sizes, the data presents more cleanly, so results will vary based on your total data points.
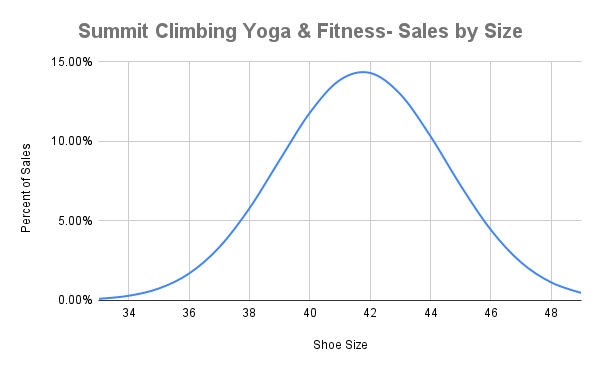 Data provided by Summit Climbing Yoga & Fitness
The mathematical equation for the Normal Distribution can be challenging for some and is often found in statistics classes.
Luckily, both Microsoft Excel and Google Sheets have options to simplify this, and lucky for you, I have done the leg work to create a simple model that can help you understand your gym’s trends in 15 minutes or less (hopefully!).
Predicting six months of sales through the pre-season process can seem daunting, but with the flexibility that exists with the programs and Bell Curve, you can rest easier. The Bell Curve helps to graph a simple prediction of the range of sizes you need on your shelves, based on historical gym data and the understanding that human foot sizes are predictable.
The graph is a nice visual to understand the theoreticals of the concept, but the real meat and potatoes are the percentages in the data itself, which you can use to predict the number of shoes you will sell in a given season!
The model includes two sections, one each for US and EU sizing and instantly spits out what percent of your future orders might be considered for each size. Every situation is unique, so consider your geographical location, historical data, and any other factors your management deems appropriate. Tools of this kind are just one factor to consider when placing your pre-season orders and you should ensure alignment with your internal leadership team and your brand representatives before placing your orders.
Download The Excel File To Create Your Own Bell Curve!
How To Use This Spreadsheet
To prepare your data, you will need to export a full list of all sales by one or more brands into a spreadsheet of your choosing. I recommend doing one brand at a time, so that you don't have to convert EU and US sizes, or account for the slight variation between brand sizes.
From there, you will need to isolate a full list of just the sizes, no gender qualifier or other data. This list should have each shoe sold as its own line item. So if your gym(s) sold 10 pairs of size 39 shoes, you would list "39" as 10 separate rows. All data can be consolidated into a single column, with no header, to then be copied into the model.
NOTE: This spreadsheet will produce percentages for predicted shoe size sales for data input you did not provide. The calculation is making educated guesses based off percentages of the data being provided, and this is how the Bell Curve is formed.
Although the model and basics are seemingly simple, every situation is unique and complex. If you don’t feel ready to tackle this type of analysis, reach out for help!
About the Author
 Paul Terbrueggen, aka Tall Paul, is an operations leader with 10+ years of experience. Working with Summit Climbing, Yoga & Fitness he served as the Retail Director and then Chief Operating Officer for their eight locations in Dallas/Fort Worth, Texas where he currently resides. Prior to that, he led teams of 25-4,500 for Amazon Fulfillment. An avid boulderer, he can often be heard claiming to be "more tall than talented" at 6'6". Paul enjoys all manner of activities, indoor or outdoor, especially when shared with his fiancée Becky and two puppies Penny Lane and Lil McGill (but everyone knows her as Nancy). In addition to writing for the CWA, Paul is an analyst for End 2 End Outdoor, representing La Sportiva, Petzl, and Big Agnes.